Średnia Ocena:
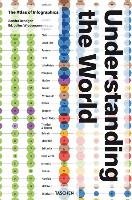
Understanding the World. The Atlas of Infographics
Planet on the pageOver 300 historic and contemporary Infographics explaining our remarkable, fragile worldGigantic and frail at the same time, our world keeps changing at high speed. New communication technologies have downsized the distances between far away continents. Data processing and network systems are changing our ways of living and working. Each second social networks are distributing myriads of information and news. Traditional mindsets are constantly being challenged and it is not easy to keep up with this evolution. This book presents a visual atlas of the world, focusing on the first quarter of the 21st century in a broad collection of information graphics, but also presenting many historical graphics from the last 150 years, putting our current situation into perspective. Divided into five big chapters, the book collects a cross-section of data from a variety of fields. How have political and economical weights shifted globally since the beginning of the century? How does the pending threat of climate change shape our thinking? More than 300 historic and contemporary infographics from sources such as Fortune, National Geographic, or The Guardian illuminate not just design professionals, they provide answers for everyone who is eager to understand how our world works. Nigel Holmes, one of the masters of information design introduces the book to the reader, and illustrated with over 20 images the historical essay by Sandra Rendgen frames how we have been looking at our world numbers for centuries. Ein visueller Atlas unserer Welt Das moderne CIA World Factbook Unsere ebenso gigantische wie gebrechliche Welt wandelt sich in atemberaubendem Tempo. Neue Kommunikationswege haben die Distanzen zwischen weit entfernten Erdteilen schrumpfen lassen. Datenverarbeitung und -vernetzung verändern unsere Art zu leben und zu arbeiten. In jeder Sekunde verbreiten soziale Netzwerke eine Unzahl an Informationen und Nachrichten. Traditionelle Denkweisen werden fortwährend auf die Probe gestellt, und es ist nicht leicht, mit diesen Entwicklungen Schritt zu halten. Dieses Buch präsentiert einen visuellen Weltatlas in einer breit angelegten Sammlung von Informationsgrafiken mit Schwerpunkt auf dem ersten Viertel des 21. Jahrhunderts. Aber es enthält auch zahlreiche historische Grafiken aus den letzten 150 Jahren, die unsere aktuelle Situation in einen geschichtlichen Zusammenhang stellen. In fünf umfangreichen Kapiteln sammelt das Buch einen Querschnitt aus Daten verschiedenster Bereiche. Wie hat sich das politische und wirtschaftliche Gewicht seit Anfang des Jahrhunderts global verändert? Wie prägt die drohende Gefahr eines Klimawandels unser Denken? Uber 300 historische und aktuelle Infografiken aus Quellen wie Fortune, National Geographic oder The Guardian werfen nicht nur ein Licht auf ihre professionellen Gestalter, sondern liefern jedem Antworten, der sich dafür interessiert, wie unsere Welt funktioniert. Nigel Holmes, einer der Meister des Informationsdesigns, stellt dem Leser das Buch vor, und die historische Abhandlung von Sandra Rendgen zeigt, bebildert mit über zwanzig Darstellungen, wie wir über die Jahrhunderte unsere Welt in Zahlen betrachtet haben.
| Szczegóły | |
|---|---|
| Tytuł | Understanding the World. The Atlas of Infographics |
| Autor: | Rendgen Sandra, Julius Wiedemann |
| Rozszerzenie: | brak |
| Język wydania: | polski |
| Ilość stron: | |
| Wydawnictwo: | Taschen GmbH |
| Rok wydania: | 2014 |
| Tytuł | Data Dodania | Rozmiar |
|---|
Understanding the World. The Atlas of Infographics PDF - podgląd:
Jesteś autorem/wydawcą tej książki i zauważyłeś że ktoś wgrał jej wstęp bez Twojej zgody? Nie życzysz sobie, aby podgląd był dostępny w naszym serwisie? Napisz na adres [email protected] a my odpowiemy na skargę i usuniemy zgłoszony dokument w ciągu 24 godzin.

To twoja książka?
Wgraj kilka pierwszych stron swojego dzieła!Zachęcisz w ten sposób czytelników do zakupu.


